@antv/g2
Version:
the Grammar of Graphics in Javascript
108 lines (77 loc) • 4.07 kB
Markdown
<img src="https://gw.alipayobjects.com/zos/antfincdn/R8sN%24GNdh6/language.svg" width="18"> [English](./README.md) | 简体中文
<h1 align="center">
<b>G2 5.0</b>
</h1>
<div align="center">
简洁的渐进式可视化语法,用于构建仪表盘、数据探索以及数据讲故事。
<p align="center">
<a href="https://g2.antv.antgroup.com/manual/introduction/what-is-g2">介绍</a> •
<a href="https://g2.antv.antgroup.com/examples">案例</a> •
<a href="https://g2.antv.antgroup.com/manual/introduction/getting-started">教程</a> •
<a href="https://g2.antv.antgroup.com/api/overview">API</a> •
<a href="https://editor.antv.antgroup.com/">Editor</a>
</p>
[](https://github.com/antvis//actions)
[](https://coveralls.io/github/antvis/g2?branch=v5)
[](https://www.npmjs.com/package/@antv/g2)
[](https://www.npmjs.com/package/@antv/g2)
[](https://www.npmjs.com/package/@antv/g2)
</div>
G2 起源于 Leland Wilkinson 的图形语法:《The Grammar of Graphics》,但又不止于图形语法。
## ✨ 特色
- **渐进式语法**:结合工业和学术实践,实现图形语法、动画语法和交互语法。
- **丰富的标记**:内置 10+ 基础标记,8+ 高阶标记。
- **高可扩展性**:提供统一机制扩展所有可视化组件。
- **个性化风格**:支持手绘、圆角、纹理等风格。
- **多环境渲染**:支持 Canvas、SVG 以及 WebGL,和 Node.js 服务端渲染。
## 🔨 开始使用
可以通过 NPM 或 Yarn 等包管理器来安装。
```bash
$ npm install @antv/g2
```
```bash
$ yarn add @antv/g2
```
成功安装之后,可以通过 import 导入 Chart 对象。
```html
<div id="container"></div>
```
```js
import { Chart } from '@antv/g2';
// 准备数据
const data = [
{ genre: 'Sports', sold: 275 },
{ genre: 'Strategy', sold: 115 },
{ genre: 'Action', sold: 120 },
{ genre: 'Shooter', sold: 350 },
{ genre: 'Other', sold: 150 },
];
// 初始化图表实例
const chart = new Chart({
container: 'container',
});
// 声明可视化
chart
.interval() // 创建一个 Interval 标记
.data(data) // 绑定数据
.encode('x', 'genre') // 编码 x 通道
.encode('y', 'sold') // 编码 y 通道
.encode('color', 'genre'); // 编码 color 通道
// 渲染可视化
chart.render();
```
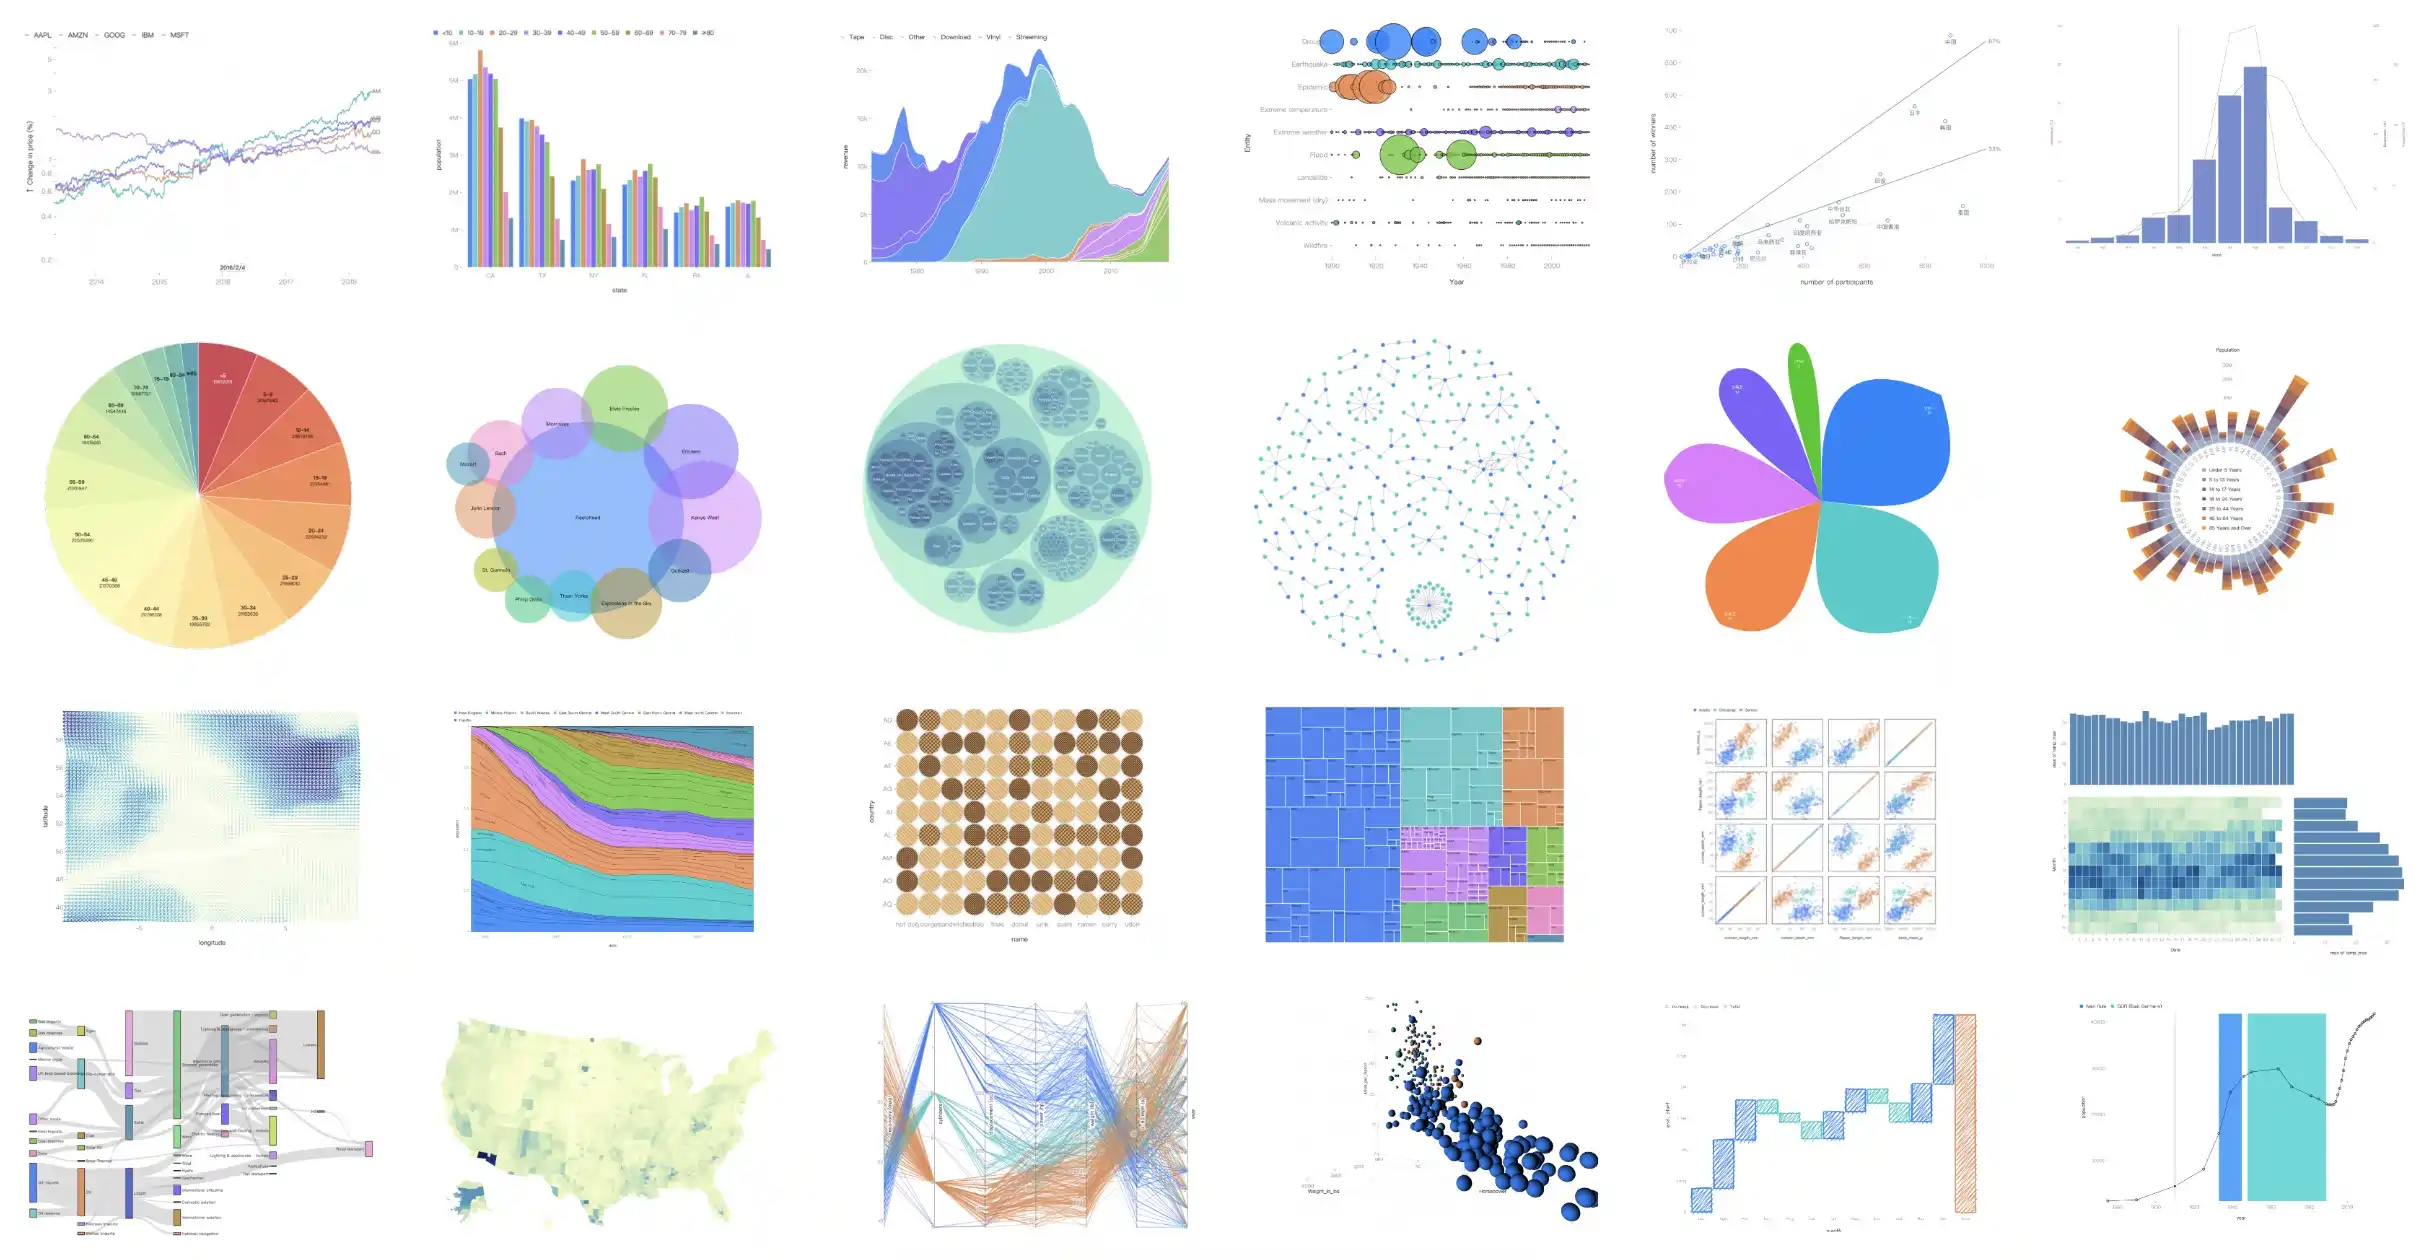
如果一切顺利,你可以得到下面的柱状图!
<img src="https://mdn.alipayobjects.com/huamei_qa8qxu/afts/img/A*XqCnTbkpAkQAAAAAAAAAAAAADmJ7AQ/fmt.webp" width="640" alt="example">
## 🌍 生态
- [g2-react](https://github.com/pearmini/g2-react) - G2 的轻量级 React 组件,没有额外特性。
- [g2-extensions](https://github.com/antvis/g2-extensions) - G2 的一系列插件库,包含 3D 和智能可视化等。
- [ant-design-charts](https://github.com/ant-design/ant-design-charts) - React 图表库,基于 [G2](https://github.com/antvis/G2), [G6](https://github.com/antvis/G6), [X6](https://github.com/antvis/X6), [L7Plot](https://github.com/antvis/L7Plot).
- [更多...](https://github.com/antvis/G2/discussions/5772)
## 📮 参与贡献
- [问题](https://github.com/antvis/g2/issues): 报告 bug 或者提出需求
- [贡献指南](https://github.com/antvis/g2/blob/v5/CONTRIBUTING.zh-CN.md):参与建设 G2
- [讨论](https://github.com/antvis/G2/discussions):在 GitHub 上或者钉钉群里面讨论(30233731, 35686967, 44788198)
<img src="https://gw.alipayobjects.com/zos/antfincdn/hTzzaqgHgQ/Antv%252520G2%252520%26%252520G2Plot.png" width="200" height="266" alt="code"/>
## 📄 许可证
MIT@[AntV](https://github.com/antvis).